The data includes the Energy Star Score, which makes this a supervised regression machine learning task:
- Supervised: we have access to both the features and the target and our goal is to train a model that can learn a mapping between the two
- Regression: The Energy Star score is a continuous variable
We are working through a supervised regression machine learning problem. Using New York City building energy data, we have developed a model which can predict the Energy Star Score of a building. The final model we built is a Gradient Boosted Regressor which is able to predict the Energy Star Score on the test data to within 9.1 points (on a 1–100 scale).
A set of conclusions, which model and data are presented:
- Using the given building energy data, a machine learning model can predict the Energy Star Score of a building to within 10 points.
- The most important variables for determining the Energy Star Score are the Energy Use Intensity, Electricity Use Intensity, and the Water Use Intensity
Final Model Performance on the test set: MAE = 9.0839
# Function to calculate mean absolute error
def mae(y_true, y_pred):
    return np.mean(abs(y_true - y_pred))

model=GradientBoostingRegressor(loss='lad',max_depth=5,max_features=None,
                                 min_samples_leaf=6, min_samples_split=6,
                                  n_estimators=800, random_state=42)
model.fit(X, y)
#  Make predictions on the test set
model_pred = model.predict(X_test)
Feature importances attempt to show the relevance of each feature to the task of predicting the target.
Feature Importance___
0 Site EUI (kBtu/ft²) 0.452163
1 Weather Normalized Site Electricity Intensity … 0.249107
2 Water Intensity (All Water Sources) (gal/ft²) 0.056662
3 Property Id 0.031396
4 Largest Property Use Type_Non-Refrigerated War… 0.025153
5 DOF Gross Floor Area 0.025003
6 log_Water Intensity (All Water Sources) (gal/ft²) 0.022335
7 Largest Property Use Type_Multifamily Housing 0.021462
8 Order 0.020169
9 log_Direct GHG Emissions (Metric Tons CO2e) 0.019410
Once we have the final predictions, we can investigate them to see if they exhibit any noticeable skew. On the left is a density plot of the actual values energy star score categorized by building type.
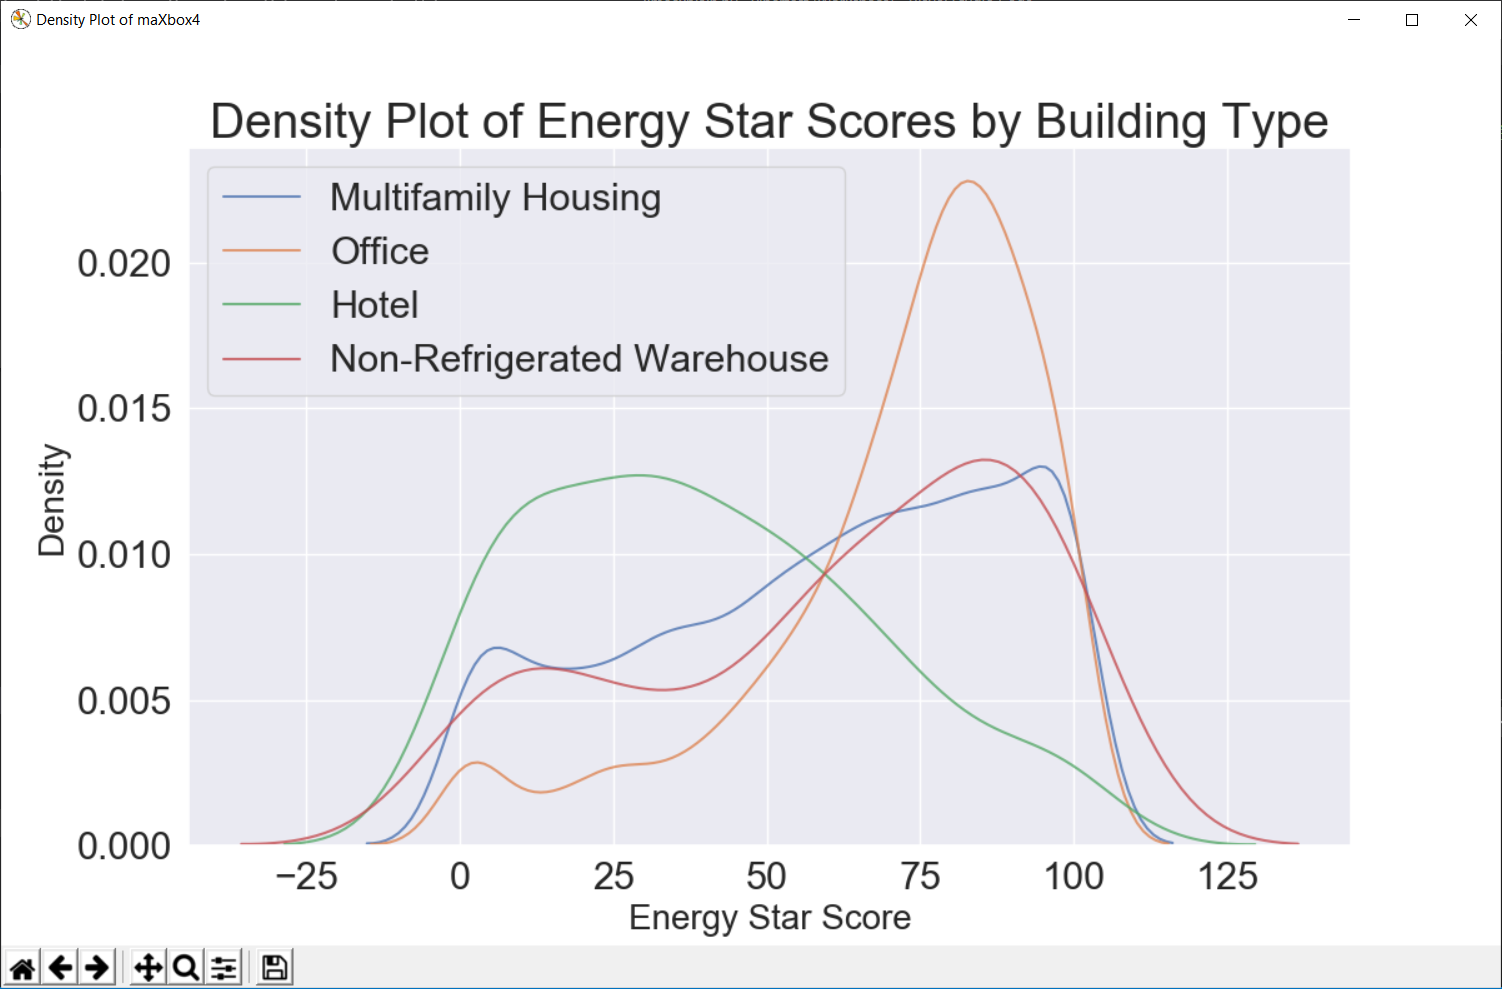
A density plot can be thought of as a smoothed histogram because it shows the distribution of a single variable. We can color a density plot by class to see how a categorical variable changes the distribution.


http://www.softwareschule.ch/examples/lime_shap_explain2.py.txt
http://www.softwareschule.ch/examples/keras_validation3.py.txt

from __future__ import print_function
import pandas as pd
import numpy as np
# Iterate through the columns
for col in list(dataf.columns):
    # Select columns that should be numeric
    if ('ft²' in col or 'kBtu' in col or 'Metric Tons CO2e' in col or 'kWh' in
        col or 'therms' in col or 'gal' in col or 'Score' in col):
        # Convert the data type to float
        dataf[col] = dataf[col].astype(float)
we do have a high accuracy to predict the language from the post question, but the success is based on a self reference in the post, most of the posts do have a hint like :
# post tag
0 how do i move something in rails i m a progr… ruby-on-rails
39128 my python cgi script for sound hangs when played … … python
the hint is “something in rails” or model that belongs to ruby-on-rails tag!
I checked this with a routine to ask which words of the target class (tags) are in the posts:
sr=[]
>>> for it in set(df.tags):
... al=len(df[df.post.str.contains(it,regex=False)])
... print(it, al)
... sr.append(it+' '+str(al))
[‘.net 3743’, ‘android 1598’, ‘angularjs 1014’, ‘asp.net 1203’, ‘c 39915’, ‘c# 1363’, ‘c++ 1304’, ‘css 2581’, ‘html 5547’, ‘ios 2062’, ‘iphone 1496’, ‘java 4213 ‘, ‘javascript 2281’, ‘jquery 2072’, ‘mysql 2014’, ‘objective-c 556’, ‘php 2513’, ‘python 1565’, ‘ruby-on-rails 23’, ‘sql 4222’]
ruby-on-rails is low with 23 but the hint is ruby in a post:
also “model” is the most important feature to detect a ruby related question in a post!
>>> len(df[df.post.str.contains(‘ruby’,regex=False)])
490>>> len(df[df.post.str.contains(‘model’,regex=False)])
1692

At least an impact analysis without preprocessing like stopwords, html-cleaning or n-grams settings:


Even beyond that, it has some very convenient and advanced functions not commonly offered by other libraries:
- Ensemble Methods: Boosting, Bagging, Random Forest, Model voting and averaging
- Feature Manipulation: Dimensionality reduction, feature selection, feature analysis
- Outlier Detection: For detecting outliers and rejecting noise
- Model selection and validation: Cross-validation, Hyperparamter tuning, and metrics


# Pandas and numpy for data manipulation
# https://pythondata.com/local-interpretable-model-agnostic-explanations-lime-python/
# https://towardsdatascience.com/explain-nlp-models-with-lime-shap-5c5a9f859b
# Purpose: shows LIME and SHAP together in 3 cases
from __future__ import print_function
import pandas as pd
import numpy as np
# No warnings about setting value on copy of slice
pd.options.mode.chained_assignment = None
pd.set_option(‘display.max_columns’, 60)
# Matplotlib for visualization
import matplotlib.pyplot as plt
#%matplotlib inline
# Set default font size
plt.rcParams[‘font.size’] = 18
from IPython.core.pylabtools import figsize
# Seaborn for visualization
import seaborn as sns
sns.set(font_scale = 2)
# Imputing missing values
from sklearn.preprocessing import Imputer, MinMaxScaler
from sklearn.impute import SimpleImputer
# Machine Learning Models
from sklearn.linear_model import LinearRegression
from sklearn.ensemble import GradientBoostingRegressor
from sklearn import tree
# LIME for explaining predictions
import lime
import lime.lime_tabular
# Read in data into a dataframe
dataf = pd.read_csv(‘data/Energy_and_Water_Data_Disclosure_for_Local_Law_84_2017__Data_for_Calendar_Year_2016_.csv’)
# Display top of dataframe
#print(dataf.head())
# cleaning
# Replace all occurrences of Not Available with numpy not a number
dataf = dataf.replace({‘Not Available’: np.nan})
# Iterate through the columns
for col in list(dataf.columns):
# Select columns that should be numeric
if (‘ft²’ in col or ‘kBtu’ in col or ‘Metric Tons CO2e’ in col or ‘kWh’ in
col or ‘therms’ in col or ‘gal’ in col or ‘Score’ in col):
# Convert the data type to float
dataf[col] = dataf[col].astype(float)
# Histogram of the Raw Energy Star Score
“””
plt.style.use(‘fivethirtyeight’)
plt.hist(dataf[‘ENERGY STAR Score’].dropna(), bins = 100, edgecolor = ‘k’)
plt.xlabel(‘Score’); plt.ylabel(‘Number of Buildings’);
plt.title(‘Energy Star Score Distribution’);
plt.show()
“””
# Create a list of buildings with more than 100 measurements
types = dataf.dropna(subset=[‘ENERGY STAR Score’])
types = types[‘Largest Property Use Type’].value_counts()
types = list(types[types.values > 100].index)
# Plot of distribution of scores for building categories
# A density plot can be thought of as a smoothed histogram because it shows
figsize(12, 10)
#fig = pyplot.gcf()
#figure(‘Density Plot maXbox4’) # 9 is now the title of the window
# Plot each building
for b_type in types:
# Select the building type
subset = dataf[dataf[‘Largest Property Use Type’] == b_type]
# Density plot of Energy Star scores
sns.kdeplot(subset[‘ENERGY STAR Score’].dropna(),
label = b_type, shade = False, alpha = 0.8);
# label the plot
plt.xlabel(‘Energy Star Score’, size = 20); plt.ylabel(‘Density’, size = 20)
plt.title(‘Density Plot of Energy Star Scores by Building Type’, size = 28)
fig = plt.gcf()
fig.canvas.set_window_title(‘Density Plot of maXbox4’)
#fig = plt.figure(‘Density Plot of maXbox4’)
#ig.set_window_title(‘Density Plot maXbox4’)
# Read in data into dataframes
train_features = pd.read_csv(‘data/training_features.csv’)
test_features = pd.read_csv(‘data/testing_features.csv’)
train_labels = pd.read_csv(‘data/training_labels.csv’)
test_labels = pd.read_csv(‘data/testing_labels.csv’)
print(train_features.info())
# print(train_labels.info())
# Create an imputer object with a median filling strategy
#imputer = Imputer(strategy=’median’)
#imputer = SimpleImputer(missing_values = np.nan, strategy = ‘mean’,verbose=0)
imputer = SimpleImputer(strategy = ‘median’,verbose=1)
# Train on the training features
imputer.fit(train_features)
# Transform both training data and testing data
X = imputer.transform(train_features)
X_test = imputer.transform(test_features)
# Sklearn wants the labels as one-dimensional vectors
y = np.array(train_labels).reshape((-1,))
y_test = np.array(test_labels).reshape((-1,))
# print(train_features.info())
# Function to calculate mean absolute error
def mae(y_true, y_pred):
return np.mean(abs(y_true – y_pred))
model = GradientBoostingRegressor(loss=‘lad’, max_depth=5, max_features=None,
min_samples_leaf=6, min_samples_split=6,
n_estimators=800, random_state=42)
model.fit(X, y)
# Make predictions on the test set
model_pred = model.predict(X_test)
print(‘Final Model Performance on the test set: MAE = %0.4f’ % mae(y_test, model_pred))
print(‘\n’)
# Find the residuals
residuals = abs(y_test – model_pred)
print(residuals)
# Extract the most wrong prediction
wrong = X_test[np.argmax(residuals), :]
# Exact the worst and best prediction
#wrong = X_test_reduced[np.argmax(residuals), :]
right = X_test[np.argmin(residuals), :]
print(‘REs Prediction: %0.4f’ % np.argmax(residuals))
print(‘Actual Value: %0.4f’ % y_test[np.argmax(residuals)])
# Extract the feature importances into a dataframe
feature_results = pd.DataFrame({‘feature’: list(train_features.columns),
‘importance’: model.feature_importances_})
# Show the top 10 most important
feature_results = feature_results.sort_values(‘importance’, ascending = False).reset_index(drop=True)
# Extract the names of the most important features
most_important_features = feature_results[‘feature’][:10]
print(feature_results.head(10))
print(most_important_features)
# pres test
for i in range(10):
try :
x = list(most_important_features[0:])
except IndexError:
print(‘IndexError, list = ‘ + str(most_important_features) + ‘, index = ‘ + str(i))
# train_features is the dataframe of training features
feature_list = list(train_features.columns)
# Create a lime explainer object
explainer = lime.lime_tabular.LimeTabularExplainer(training_data = X_test,
mode = ‘regression’,
training_labels = y, #,
feature_names = feature_list)
# Display the predicted and true value for the wrong instance
print(‘Prediction: %0.4f’ % model.predict(wrong.reshape(1, –1)))
print(‘Actual Value: %0.4f’ % y_test[np.argmax(residuals)])
# Explanation for wrong prediction
wrong_exp = explainer.explain_instance(data_row = wrong,
predict_fn = model.predict)
# Plot the prediction explaination
figsize(16, 6)
wrong_exp.as_pyplot_figure()
plt.title(‘Explanation of Prediction’, size = 28)
plt.xlabel(‘Effect on Prediction’, size = 22)
#plt.show()
# Let’s graph the feature importances to compare visually.
figsize(12, 6)
#plt.style.use(‘fivethirtyeight’)
# Plot the 10 most important features in a horizontal bar chart
feature_results.loc[:9, :].plot(x = ‘feature’, y = ‘importance’,
edgecolor = ‘k’,
kind=‘barh’, color = ‘blue’);
plt.xlabel(‘Relative Importance’, size = 15); plt.ylabel(”)
plt.title(‘Feature Importances from Random Forest’, size = 20)
plt.show()
# For example, SHAP has a tree explainer that runs fast on trees, such as gradient
# Load Boston Housing Data

import shap
from sklearn.model_selection import train_test_split
import sklearn
import time
X,y = shap.datasets.boston()
X_train,X_test,y_train,y_test = train_test_split(X, y, test_size=0.2, random_state=0)
X,y = shap.datasets.boston()
X_train,X_test,y_train,y_test = train_test_split(X, y, test_size=0.2, random_state=0)
# K Nearest Neighbor
knn = sklearn.neighbors.KNeighborsRegressor()
knn.fit(X_train, y_train)
# Create the SHAP Explainers
# SHAP has the following explainers: deep, gradient, kernel, linear, tree, sampling

# Must use Kernel method on knn
# Summarizing the data with k-Means is a trick to speed up the processing
“””

Rather than use the whole training set to estimate expected values, we summarize with

a set of weighted kmeans, each weighted by the number of points they represent.

Running without kmeans took 1 hr 6 mins 7 sec. 
Running with kmeans took 2 min 47 sec.

Boston Housing is a small dataset.

Running SHAP on models that require the Kernel method becomes prohibitive.

”””
# build the kmeans summary
X_train_summary = shap.kmeans(X_train, 10)
# using the kmeans summary
“””
t0 = time.time()
explainerKNN = shap.KernelExplainer(knn.predict,X_train_summary)
shap_values_KNN_test = explainerKNN.shap_values(X_test)
t1 = time.time()
timeit=t1-t0
timeit
“””
# without kmeans# a test run took 3967.6232330799103 seconds
“””
t0 = time.time()
explainerKNN = shap.KernelExplainer(knn.predict, X_train)
shap_values_KNN_test = explainerKNN.shap_values(X_test)
t1 = time.time()
timeit=t1-t0timeit
“””
# now we can plot the SHAP explainer
j = int
j = 10
#shap.force_plot(explainerKNN.expected_value, shap_values_KNN_test[j], X_test.iloc[[j]])
#Getting started with Local Interpretable Model-agnostic Explanations (LIME)
# https://pythondata.com/local-interpretable-model-agnostic-explanations-lime-python/
from sklearn.datasets import load_boston
boston = load_boston()
print (boston[‘DESCR’])
rf = sklearn.ensemble.RandomForestRegressor(n_estimators=1000)
train, test, labels_train, labels_test = train_test_split(boston.data, boston.target, train_size=0.80)
rf.fit(train, labels_train)
#Now that we have a Random Forest Regressor trained, we can check some of the accuracy measures.
print(‘Random Forest MSError’, np.mean((rf.predict(test) – labels_test) ** 2))
# Tbe MSError is: 7.561741634411746 – 10.45. Now, let’s look at the MSError when predicting the mean.
print(‘MSError when predicting the mean’, np.mean((labels_train.mean() – labels_test) ** 2))
#To implement LIME, we need to get the categorical features from our data and then build an ‘explainer’.
categorical_features = np.argwhere(
np.array([len(set(boston.data[:,x]))
for x in range(boston.data.shape[1])]) <= 10).flatten()
print(categorical_features)
explainer = lime.lime_tabular.LimeTabularExplainer(train,
feature_names=boston.feature_names,
class_names=[‘price’],
categorical_features=categorical_features,
verbose=True, mode=‘regression’)
#Now, we can grab one of our test values and check out our prediction(s). Here, we’ll grab the 100th test
#value and check the prediction and see what the explainer has to say about it.
#https://shirinsplayground.netlify.com/2018/06/keras_fruits_lime/
i = 100
exp = explainer.explain_instance(test[i], rf.predict, num_features=5)
#print(‘available_labels(): ‘,exp.available_labels())
#raise NotImplementedError(‘Not supported for regression explanations.’)
exp.show_in_notebook(show_table=True)
exp.save_to_file(‘data/limeexplain34.html’)
# Plot the prediction explanation
#exp.as_pyplot_figure();
# plt.show()
# print(exp.as_list(label=8))
print (‘\n’.join(map(str, exp.as_list(label=8))))
# https://towardsdatascience.com/explain-nlp-models-with-lime-shap-5c5a9f84d59b
import pandas as pd
import numpy as np
import sklearn
import sklearn.ensemble
import sklearn.metrics
from sklearn.utils import shuffle
from io import StringIO
import re
from bs4 import BeautifulSoup
from nltk.corpus import stopwords
from sklearn.model_selection import train_test_split
from sklearn.feature_extraction.text import CountVectorizer
from sklearn.linear_model import LogisticRegression
from sklearn.metrics import accuracy_score, f1_score, precision_score, recall_score
import lime
from lime import lime_text
from lime.lime_text import LimeTextExplainer
from sklearn.pipeline import make_pipeline
df = pd.read_csv(‘data/stack-overflow-data.csv’)
df = df[pd.notnull(df[‘tags’])]
#print (df.groupby(‘tags’).count().sort_values([‘tags’]))
df = df.sample(frac=0.5, random_state=99).reset_index(drop=True)
df = shuffle(df, random_state=22)
df = df.reset_index(drop=True)
df[‘class_label’] = df[‘tags’].factorize()[0]
class_label_df = df[[‘tags’, ‘class_label’]].drop_duplicates().sort_values(‘class_label’)
label_to_id = dict(class_label_df.values)
id_to_label = dict(class_label_df[[‘class_label’, ‘tags’]].values)
print(df.info())
print(df.head(5))
REPLACE_BY_SPACE_RE = re.compile(r'[/(){}\[\]\|@,;]’)
BAD_SYMBOLS_RE = re.compile(‘[^0-9a-z #+_]’)
# STOPWORDS = set(stopwords.words(‘english’))
def clean_text(text):
“””
text: a string
return: modified initial string
“””
text = BeautifulSoup(text, “lxml”).text
# HTML decoding. BeautifulSoup’s text attribute will return a string stripped of any HTML tags and metadata.
text = text.lower() # lowercase text
text = REPLACE_BY_SPACE_RE.sub(‘ ‘, text)
# replace REPLACE_BY_SPACE_RE symbols by space in text. substitute the matched string in REPLACE_BY_SPACE_RE with space.
text = BAD_SYMBOLS_RE.sub(”, text)
# remove symbols which are in BAD_SYMBOLS_RE from text. substitute the matched string in BAD_SYMBOLS_RE
# with nothing.
# text = ‘ ‘.join(word for word in text.split() if word not in STOPWORDS) # remove stopwors from text
return text
df[‘post’] = df[‘post’].apply(clean_text)
list_corpus = df[“post”].tolist()
list_labels = df[“class_label”].tolist()
print(set(df[‘tags’]))
print (df.groupby(‘tags’).count())
X_train, X_test, y_train, y_test = train_test_split(list_corpus, list_labels, test_size=0.2, random_state=40)
vectorizer = CountVectorizer(analyzer=‘word’, token_pattern=r’\w{1,}’,
ngram_range=(1, 3), stop_words = ‘english’, binary=True)
train_vectors = vectorizer.fit_transform(X_train)
test_vectors = vectorizer.transform(X_test)
logreg = LogisticRegression(n_jobs=1, C=1e5)
logreg.fit(train_vectors, y_train)
pred = logreg.predict(test_vectors)
accuracy = accuracy_score(y_test, pred)
precision = precision_score(y_test, pred, average=‘weighted’)
recall = recall_score(y_test, pred, average=‘weighted’)
f1 = f1_score(y_test, pred, average=‘weighted’)
print(“accuracy = %.3f, precision = %.3f, recall = %.3f, f1 = %.3f” % (accuracy, precision, recall, f1))
c = make_pipeline(vectorizer, logreg)
class_names=list(df.tags.unique())
explainer = LimeTextExplainer(class_names=class_names)
idx = 1877
exp = explainer.explain_instance(X_test[idx], c.predict_proba, num_features=6, labels=[4, 8])
print(‘Document id: %d’ % idx)
print(‘Predicted class =’, class_names[logreg.predict(test_vectors[idx]).reshape(1,-1)[0,0]])
print(‘True class: %s’ % class_names[y_test[idx]])
# We randomly select a document in test set, it happens to be a document that labeled as sql,
# and our model predicts it as sql as well. Using this document, we generate explanations
# for label 4 which is sql and label 8 which is python.
print (‘Explanation for class %s’ % class_names[4])
print (‘\n’.join(map(str, exp.as_list(label=4))))
print (‘Explanation for class %s’ % class_names[8])
print (‘\n’.join(map(str, exp.as_list(label=8))))
# We are going to generate labels for the top 2 classes for this document.
exp = explainer.explain_instance(X_test[idx], c.predict_proba, num_features=6, top_labels=2)
print(exp.available_labels())
exp.show_in_notebook(text=y_test[idx], labels=(4,))
exp.save_to_file(‘data/stackoverflowlimeexplain34_sql.html’)
exp.show_in_notebook(text=y_test[idx], labels=(8,))
exp.save_to_file(‘data/stackoverflowlimeexplain38_python.html’)
#exp = explainer.explain_instance(X_test[idx], c.predict_proba, num_features=6, top_labels=2)
#print(exp.available_labels())
#exp.show_in_notebook(text=False)
#exp.as_pyplot_figure(labels = exp.available_labels());
#plt.show()
# It gives us sql and python.
# Interpreting text predictions with SHAP
# https://towardsdatascience.com/explain-nlp-models-with-lime-shap-5c5a9f84d59b
from sklearn.preprocessing import MultiLabelBinarizer
import tensorflow as tf
from tensorflow.keras.preprocessing import text
import keras.backend.tensorflow_backend as K
K.set_session
import shap
tags_split = [tags.split(‘,’) for tags in df[‘tags’].values]
tag_encoder = MultiLabelBinarizer()
tags_encoded = tag_encoder.fit_transform(tags_split)
num_tags = len(tags_encoded[0])
train_size = int(len(df) * .8)
print(‘lang labels count: ‘,num_tags)
y_train = tags_encoded[: train_size]
y_test = tags_encoded[train_size:]
class TextPreprocessor(object):
def __init__(self, vocab_size):
self._vocab_size = vocab_size
self._tokenizer = None
def create_tokenizer(self, text_list):
tokenizer = text.Tokenizer(num_words = self._vocab_size)
tokenizer.fit_on_texts(text_list)
self._tokenizer = tokenizer
def transform_text(self, text_list):
text_matrix = self._tokenizer.texts_to_matrix(text_list)
return text_matrix
VOCAB_SIZE = 500
train_post = df[‘post’].values[: train_size]
test_post = df[‘post’].values[train_size: ]
processor = TextPreprocessor(VOCAB_SIZE)
processor.create_tokenizer(train_post)
X_train = processor.transform_text(train_post)
X_test = processor.transform_text(test_post)
def create_model(vocab_size, num_tags):
model = tf.keras.models.Sequential()
model.add(tf.keras.layers.Dense(50, input_shape = (VOCAB_SIZE,), activation=‘relu’))
model.add(tf.keras.layers.Dense(25, activation=‘relu’))
model.add(tf.keras.layers.Dense(num_tags, activation=‘sigmoid’))
model.compile(loss = ‘binary_crossentropy’, optimizer=‘adam’, metrics = [‘accuracy’])
return model
model = create_model(VOCAB_SIZE, num_tags)
model.fit(X_train, y_train, epochs = 2, batch_size=128, validation_split=0.1)
print(‘Eval loss/accuracy:{}’.format(model.evaluate(X_test, y_test, batch_size = 128)))
attrib_data = X_train[:200]
explainer = shap.DeepExplainer(model, attrib_data)
num_explanations = 20
shap_vals = explainer.shap_values(X_test[:num_explanations])
words = processor._tokenizer.word_index
word_lookup = list()
for i in words.keys():
word_lookup.append(i)
word_lookup = [”] + word_lookup
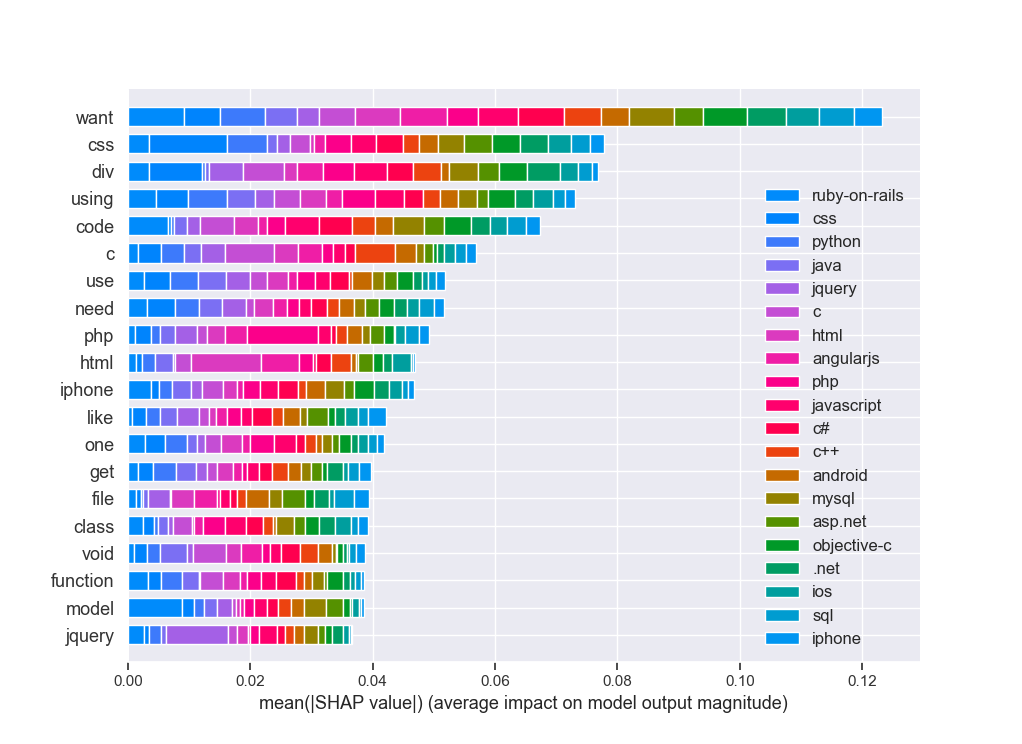
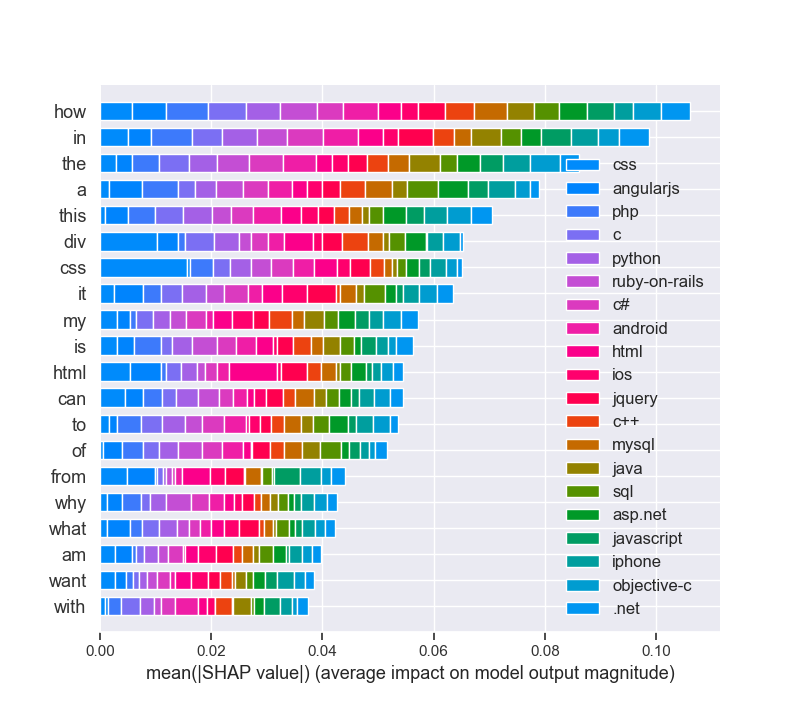
shap.summary_plot(shap_vals, feature_names=word_lookup, class_names=tag_encoder.classes_)
print(‘end of EAI LIME & SHAP box trix___KERAS____’)
“””
ERROR: sonnet 0.1.6 has requirement networkx==1.8.1, but you’ll have networkx 2.4 which is incompatible.
Installing collected packages: progressbar, lime, networkx
Found existing installation: networkx 1.8.1
Uninstalling networkx-1.8.1:
Successfully uninstalled networkx-1.8.1
Successfully installed lime-0.1.1.37 networkx-2.4 progressbar-2.5
PS r C:\maXbox\maxbox3\maxbox3\maXbox3\crypt\viper2> pip3 install shap
Collecting shap
(298kB)
|████████████████████████████████| 307kB 1.7MB/s
Requirement already satisfied: numpy in \lib\site-packages (from shap) (1.16.3)
Requirement already satisfied: scikit-learn in \lib\site-packages (from shap) (0.20.3)
Requirement already satisfied: pandas in lib\site-packages (from shap) (0.24.2)
Requirement already satisfied: scipy in \lib\site-packages (from shap) (1.2.0)
Requirement already satisfied: tqdm>4.25.0 in \lib\site-packages (from shap) (4.31.1)
Requirement already satisfied: pytz>=2011k in \python37\lib\site-packages (from pandas->shap) (2019.1)
Requirement already satisfied: python-dateutil>=2.5.0 in python37\lib\site-packages (from pandas->shap) (2.7.5)
Requirement already satisfied: six>=1.5 in \python37\lib\site-packages (from python-dateutil>=2.5.0->pandas->shap) (1.12.0)
Installing collected packages: shap
Successfully installed shap-0.34.0
WARNING: You are using pip version 19.1, however version 20.0.1 is available.
You should consider upgrading via the ‘python -m pip install –upgrade pip’ command.
PS C:\maXbox\maxbox3\maxbox3\maXbox3\crypt\viper2>
In the first two parts of this project, we implemented the first 6 steps of the machine learning pipeline:
Data cleaning and formatting
Exploratory data analysis
Feature engineering and selection
Compare several machine learning models on a performance metric
Perform hyperparameter tuning on the best model to optimize it for the problem
Evaluate the best model on the testing set
Interpret the model results to the extent possible
Draw conclusions and write a well-documented report
Here’s how to interpret the plot: Each entry on the y-axis indicates one value of a variable and the red and green bars show
the effect this value has on the prediction. For example, the top entry says the Site EUI is greater than 95.90 which subtracts
about 40 points from the prediction. The second entry says the Weather Normalized Site Electricity Intensity is less
than 3.80 which adds about 10 points to the prediction. The final prediction is an intercept term plus the sum of each
of these individual contributions.
library(keras) # for working with neural nets
library(lime) # for explaining models
library(magick) # for preprocessing images
library(ggplot2) # for additional plotting
Intercept 26.62833899477304
Prediction_local [16.78374133]
Right: 8.788700000000027
<IPython.core.display.HTML object>
(‘LSTAT > 17.09’, -4.89649843884296)
(‘5.91 < RM <= 6.23’, -3.913881918724065)
(‘NOX > 0.62’, -1.1532969589236963)
(‘DIS <= 2.11’, 0.8798771793667672)
(‘18.95 < PTRATIO <= 20.20’, -0.76079752709186)
end of EAI box trix___
Intercept 23.888469758845538
Prediction_local [24.06097282]
Right: 25.466100000000058
<IPython.core.display.HTML object>
(‘6.21 < RM <= 6.60’, -2.398134087581002)
(‘7.20 < LSTAT <= 11.30’, 1.914742343880133)
(‘TAX <= 281.00’, 0.7204900819903772)
(‘CHAS=0’, -0.5690170981066284)
(‘17.38 < PTRATIO <= 19.05’, 0.5044218222752127)
def explain_instance(data_row, predict_fn, labels=(1,), top_labels=None, num_features=10,
num_samples=5000, distance_metric=’euclidean’, model_regressor=None)
Generates explanations for a prediction.
First, we generate neighborhood data by randomly perturbing features from the instance (see __data_inverse).
We then learn locally weighted linear models on this neighborhood data to explain each of the classes in an
interpretable way (see lime_base.py).
Args:
data_row: 1d numpy array or scipy.sparse matrix, corresponding to a row
predict_fn: prediction function. For classifiers, this should be a
function that takes a numpy array and outputs prediction
probabilities. For regressors, this takes a numpy array and
returns the predictions. For ScikitClassifiers, this is
`classifier.predict_proba()`. For ScikitRegressors, this
is `regressor.predict()`. The prediction function needs to work
on multiple feature vectors (the vectors randomly perturbed
from the data_row).
labels: iterable with labels to be explained.
top_labels: if not None, ignore labels and produce explanations for
the K labels with highest prediction probabilities, where K is
this parameter.
num_features: maximum number of features present in explanation
num_samples: size of the neighborhood to learn the linear model
distance_metric: the distance metric to use for weights.
model_regressor: sklearn regressor to use in explanation. Defaults
to Ridge regression in LimeBase. Must have model_regressor.coef_
and ‘sample_weight’ as a parameter to model_regressor.fit()
Returns:
An Explanation object (see explanation.py) with the corresponding
explanations.
Q: Each time I run the demo I got different explanation!! RAD=24 is not always the most positive
A: That’s not a surprise.
LIME is ‘an algorithm that can explain the predictions of any classifier or regressor in a faithful way,
by approximating it locally with an interpretable model’
I would expect it to provide slightly different results when you run it with this dataset.
“””


most words of stack overflow
from collections import Counter
>>> words = df.post.str.split(‘ ‘)
def convert(list):
return tuple(i for i in list)
atups= convert(words)
>>> bigstr= str(df.post)
>>> words = bigstr.split()
word_counts = Counter(words)
>>> word_counts = Counter(str(atups))
>>> word_counts = Counter(df.post.values)
top_100 = word_counts.most_common(100)
print(top_100)
[(‘to’, 25), (‘…’, 18), (‘a’, 17), (‘i’, 17), (‘in’, 13), (‘the’, 13), (‘how’,
11), (‘is’, 6), (‘error’, 6), (‘from’, 6), (‘of’, 6), (‘file’, 6), (‘have’, 5),
(‘and’, 5), (‘when’, 5), (‘on’, 5), (‘what’, 4), (‘trying’, 4), (‘for’, 4), (‘-
‘, 4), (‘with’, 4), (‘string’, 4), (‘an’, 3), (‘show’, 3), (‘need’, 3), (”, 3), (‘asp.net’, 3), (‘sql’, 3), (‘query’, 3), (‘code’, 3), (‘way’, 3),
(‘not’, 3), (‘multiple’, 3), (‘this’, 2), (‘c#’, 2), (‘1’, 2), (‘dynamic’, 2), (
‘load’, 2), (‘as’, 2), (‘if’, 2), (‘it’, 2), (‘was’, 2), (‘2’, 2), (‘.net’, 2),
(‘4’, 2), (‘name’, 2), (‘my’, 2), (‘website’, 2), (‘6’, 2), (‘iphone’, 2), (‘key
‘, 2), (‘rails’, 2), (‘m’, 2), (‘rather’, 2), (‘these’, 2), (‘drive’, 2), (‘conn
ection’, 2), (‘syntax’, 2), (‘want’, 2), (‘add’, 2), (‘between’, 2), (‘or’, 2),
(‘jquery’, 2), (‘google’, 2), (‘url’, 2), (‘function’, 2), (‘converting’, 2), (‘
delete’, 2), (‘i…’, 2), (‘help’, 2), (‘get’, 2), (‘tables’, 2), (‘0’, 1), (‘ca
using’, 1), (‘behavior’, 1), (‘our’, 1), (‘datet…’, 1), (‘html’, 1), (‘ifra…
‘, 1), (‘convert’, 1), (‘float’, 1), (‘value’, 1), (‘min:sec’, 1), (‘3’, 1), (‘f
ramework’, 1), (‘redistributable’, 1), (‘just’, 1), (‘wonderi…’, 1), (‘calcula
te’, 1), (‘print’, 1), (‘mean’, 1), (‘its…’, 1), (‘5’, 1), (‘give’, 1), (‘alia
s’, 1), (‘window.open()’, 1), (‘returns’, 1), (‘null’, 1), (‘angularjs’, 1), (‘wo…’, 1)]
LikeLike
whats the difference count a substring?:
>>> len(df[df.post.str.contains(‘python’,regex=False)])
1565
>>> print(df.post.str.count(‘python’).sum())
3208
>>> count = df[‘post’].str.split().apply(len).value_counts()
>>> len(count)
921
>>> len(df.post)
40000
>>> count.index = count.index.astype(str) + ‘ words:’
>>> count.sort_index(inplace=True)
LikeLike
>>> df = pd.DataFrame([‘one apple’,’banana’,’box of oranges’,’pile of fruits outside’, ‘one banana’, ‘fruits’])
>>> df.columns = [‘fruits’]
>>> len(df[df.fruits.str.contains(‘banana’,regex=False)])
2
>>> print(df.fruits.str.count(‘banana’).sum())
2
LikeLike
>>> df = pd.DataFrame([‘one apple’,’banana’,’box of oranges’,’pile of fruits out
side’, ‘one banana and banana’, ‘fruits’])
>>> print(df.fruits.str.count(‘banana’).sum())
3
>>> len(df[df.fruits.str.contains(‘banana’,regex=False)])
2
count with substrings –> 3
contains without substring –> 2
LikeLike