
////////////////////////////////////////////////////////////////////////////////
AGSI Data Storage Report
__________________________________________________________________
maXbox Starter 99 – Data representation of gas in storage as a timeline AGSI dataset.
There are many kinds of data scientists:
a) Those who dive in data are the best.
This data science tutorial explains the so called AGSI data storage and his visualisation of the time line. AGSI is the Aggregated Gas Storage Inventory and offers you the possibility to be kept up to date whenever a new service announcement or update from one of our data providers is posted on the website.
The Gas Infrastructure Europe (GIE) is also providing related data such as the Storage Map and Storage Investment Database at https://www.gie.eu/publications/maps/
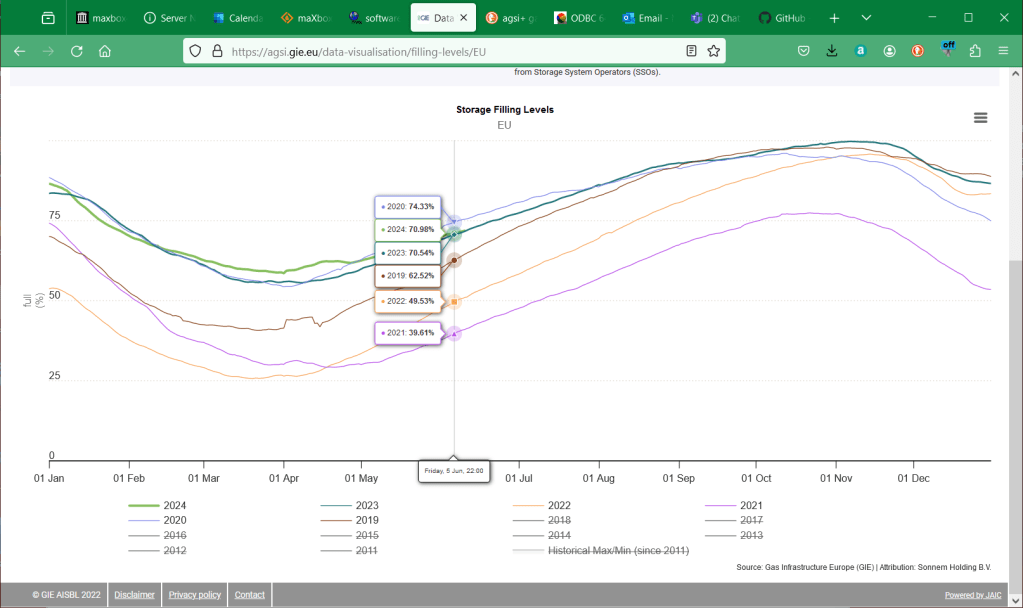
The result of the data will be the chart below:
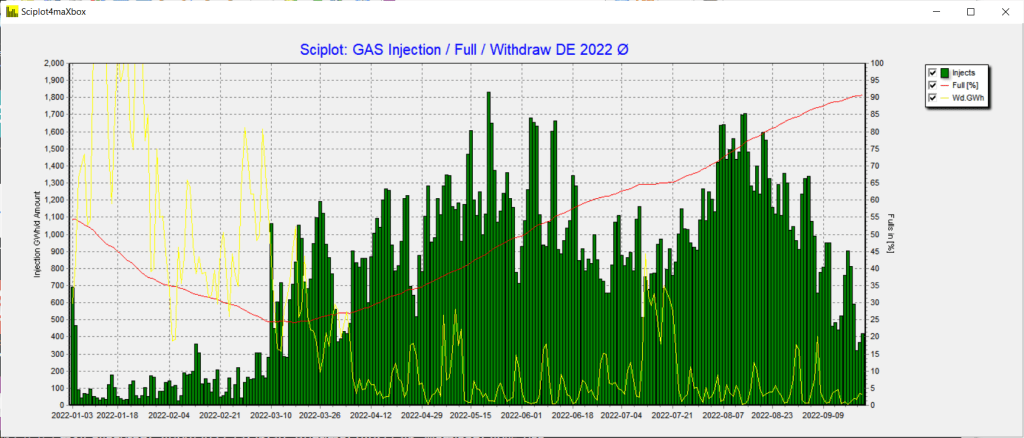
Pic: 1154_agsi_plot13.png
We use WinHttp.WinHttpRequest, JSONObjects and TEECharts library with loading and testing the plot. Also an API-key is needed, get the key first at: https://agsi.gie.eu/account
The data represents gas in storage at the end of the previous gas day. Data is updated every day at 19:30 CET and a second time at 23:00. Before we dive into code this is the main part of the script:
plotform:= getForm2(1400, 600, clsilver, 'Sciplot4maXbox');

plotform.icon.loadfromresourcename(hinstance,'ZHISTOGRAM');

HttpResponse:=

getEnergyStreamJSON2(URL_AGSIAPI2,'DE,2022-01-03,150',AGSI_APIKEY);

JSON2Plot(plotform, letGenerateJSON2(HttpResponse));
The main part generates a form, invokes the API and plots the data.
GIE is providing an API (Application Programming Interface) service on its AGSI and ALSI transparency publication platforms.
Using API access, consumer can bypass the AGSI and ALSI website and get hold of the data directly and continuously. It enables to extract, filter, aggregate the data and create any subset as required, without having to download each dataset separately from the website. The API export format is JSON. For example a subset of 150 days:
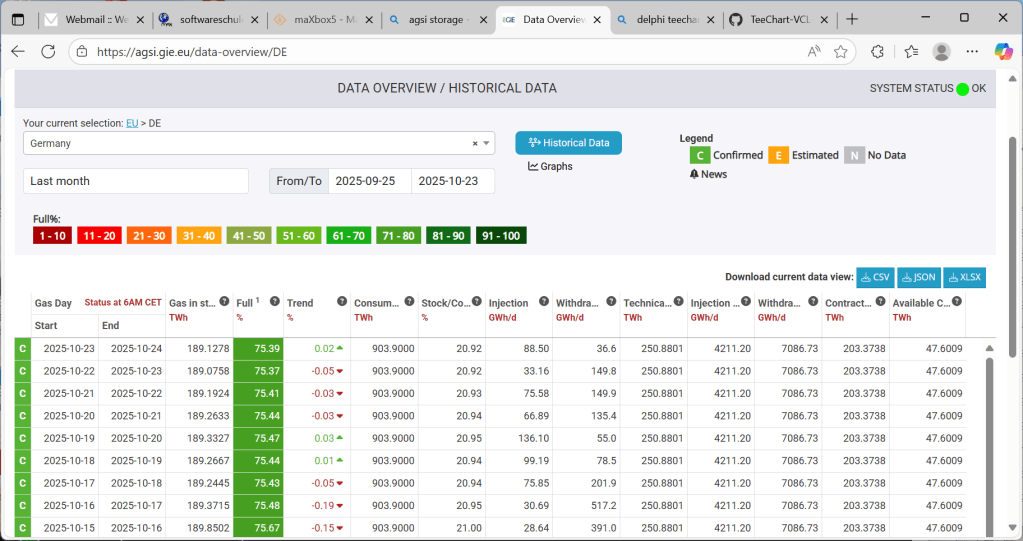
The published datasets are based on the EIC code mapping table provided to ACER. Storage data is aggregated by company, and country.
With the call I pass country, start-date and amount of days:
getEnergyStreamJSON2(URL_AGSIAPI2,'DE,2022-01-03,150',AGSI_APIKEY);
All available datasets can be downloaded also in Excel, CSV and JSON format. The data in this report shows an aggregated view – individual datasets by company and storage facility are also accessible.

So lets start with the API call:
<!-- wp:paragraph -->
<p>HttpResponse:=</p>
<!-- /wp:paragraph -->

<!-- wp:paragraph -->
<p>getEnergyStreamJSON2(URL_AGSIAPI2,'DE,2022-01-03,150',AGSI_APIKEY);</p>
<!-- /wp:paragraph -->
This command and script runs WinHttp.WinHttpRequest. When you fail you get a bunch of exceptions like the following:
Exception: WinHttp.WinHttpRequest: The data necessary to complete this operation is not yet available; or you missed a valid key:
AGSIPost: Failed at getting response:403{

"error": {

"code": 403,

"message": "The request is missing a valid API key.",

"status": "PERMISSION_DENIED"

}}
The funny thing is the JSON formatted exception. Be also carefully to expose your key as I get from Git: GitGuardian has detected the following Google API Key exposed within your GitHub account.
Next is the formatting of the get-call with a valid API-key request in the function energyStream()
function getEnergyStreamJSON2(AURL,feedstream,aApikey:string): string;

...

encodURL:= Format(AURL,[HTTPEncode(asp[0]),(asp[1]),asp[2]]);
writeln(encodurl) //debug
hr:= httpRq.Open('GET', encodURL, false);
httpRq.setRequestheader('user-agent',USERAGENTE);
httpRq.setRequestheader('x-key',aAPIkey);

...
And where is the fabulous content-type? As far as I understood there are only two places in a web-request where to set a content-type:
- The client sets a content type for the body he is sending to the server (e.g. for get and post).
- The server sets a content type for the response.
A sender that generates a message containing a payload body has to generate a Content-Type header field in that message unless the intended media type of the enclosed representation is unknown to the sender; otherwise we failed at getting response: 503503 – Service Unavailable.
- (‘headers={“Content-Type”:”application/json”}’)
- httpRq.setRequestheader(‘Content-Type’,application/json);
It means that the content-type HTTP header should be set only for PUT and POST requests. GET requests can have “Accept” headers, which say which types of content the client understands. The server can then use that to decide which content type to send back.
As an option you can also use TALWinInetHttpClient. It is a easy to use WinInet-based protocol and supports HTTPs. HTTP client component which allows to post and get any data from the Web via HTTP protocol.
function TALHTTPClient_Get(aUrl:AnsiString; feedstream,aApikey:
                                                 string): string;

Var LHttpClient: TALWininetHttpClient; asp:TStringArray;

begin
 LHttpClient:= TALWininetHttpClient.create;
 asp:= splitStr(feedstream,',');
 LHttpClient.url:= Format(AURL,[HTTPEncode(asp[0]),
                                           asp[1]),asp[2]]);

 LHttpClient.RequestMethod:= HTTPmt_Get; //HTTPrm_Post;
 LHttpClient.RequestHeader.UserAgent:=USERAGENTE;
 //LHttpClient.RequestHeader.CustomHeaders:=
 LHttpClient.RequestHeader.RawHeaderText:='x-key:'+aAPIkey;
try
 result:= LHttpClient.Get1(LHttpClient.url); //overload;
finally
 LHttpClient.Free;
end;
end;
Any missing or incomplete data is also be visible on AGSI. Next we step to the conversion of our JSON response for the plot with TJSONObject:
function letGenerateJSON2(HttpRqresponseText: string): TJSONArray;
var jo: TJSONObject;
begin
  jo:= TJSONObject.Create4(HttpRqresponseText);
  try
    //writeln(jo.getstring('data'));
    writeln(itoa(jo.getjsonarray('data').getjsonobject(0).length))
    writeln(itoa(jo.getjsonarray('data').length))
    result:= jo.getjsonarray('data');
    //write out to check
    for it:= 0 to result.length-1 do
       writeln(result.getjsonobject(it).getstring('gasDayStart')+':'+
                      result.getjsonobject(it).getstring('injection'));
  except
    writeln('EJson: '+ExceptiontoString(exceptiontype, exceptionparam));
  end;
end;

function getEnergyStreamJSON2(AURL, feedstream, aApikey: string): string;
var encodURL: string;
    httpRq,hr: Olevariant;
    asp: TStringArray;
begin
  httpRq:= CreateOleObject('WinHttp.WinHttpRequest.5.1');
  // Opens HTTPs connection.
  try
    asp:= splitStr(feedstream,',');
    encodURL:= Format(AURL,[HTTPEncode(asp[0]),(asp[1]),asp[2]]);
    writeln(encodurl)
    hr:= httpRq.Open('GET', encodURL, false);
    httpRq.setRequestheader('user-agent',USERAGENTE);
    httpRq.setRequestheader('x-key',aAPIkey);
    if hr= S_OK then HttpRq.Send();
    If HttpRq.Status = 200 Then
       result:= HttpRq.responseText
    Else result:= 'Failed getting response:'+itoa(HttpRq.Status)+HttpRq.responseText;
        //writeln('debug response: '+HttpReq.GetAllResponseHeaders);
  except
    writeln('Error: '+HttpRq.responseText);
    writeln('EHTTP: '+ExceptiontoString(exceptiontype, exceptionparam));
  finally
    httprq:= unassigned;
  end;
end;
Using API access, the audience can bypass the AGSI and ALSI website and get hold of the data directly and continuously.
And this JSON Array as above function returns, we pass to the next plot:
procedure JSON2Plot(form1: TForm; jar: TJSONArray);
var chart1: TChart;
    cnt: integer; sumup,tmp2,tmp: double; gday: string;
begin
  form1.onclose:= @Form_CloseClick;
  chart1:= ChartInjector(form1);
  sumup:=0; tmp2:=0; tmp:=0;
  try
   for cnt:= 0 to jar.length-1 do begin
     //writeln(locate.getjsonobject(it).getstring('gasDayStart')+':'+
     tmp:= jar.getjsonobject(jar.length-1-cnt).getdouble('injection');
     tmp2:= jar.getjsonobject(jar.length-1-cnt).getdouble('full');
     sumup:= sumup+tmp;
     gday:= jar.getjsonobject(jar.length-1-cnt).getstring('gasDayStart');
     chart1.Series[0].Addxy(cnt,tmp,gday,clgreen);
     chart1.Series[1].Addxy(cnt,tmp2,'',clred);
     chart1.Series[2].Addxy(cnt,jar.getjsonobject(jar.length-1-cnt).getdouble('withdrawal'),'',clyellow);
   end;
  except
    writeln('EPlot: '+ExceptiontoString(exceptiontype, exceptionparam));
  end;
 PrintF('Landrange %d: Injection sum: %.2f', [jar.length-1, sumup]);
end;
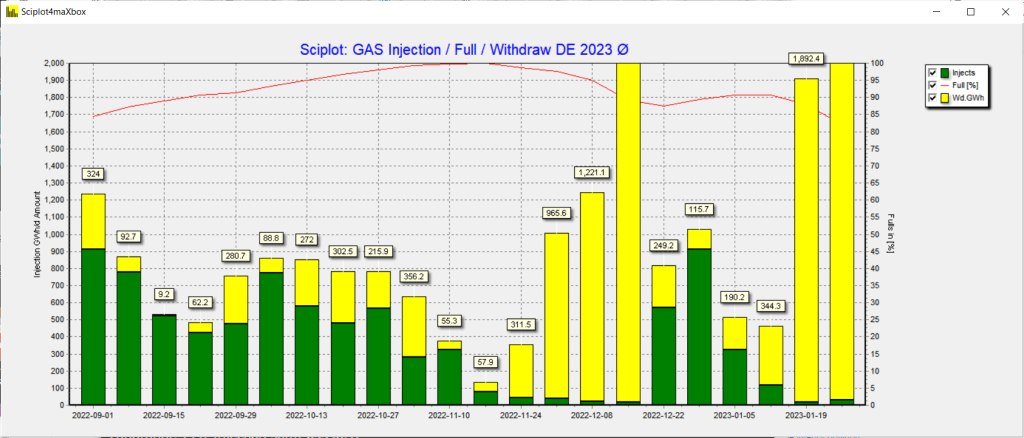
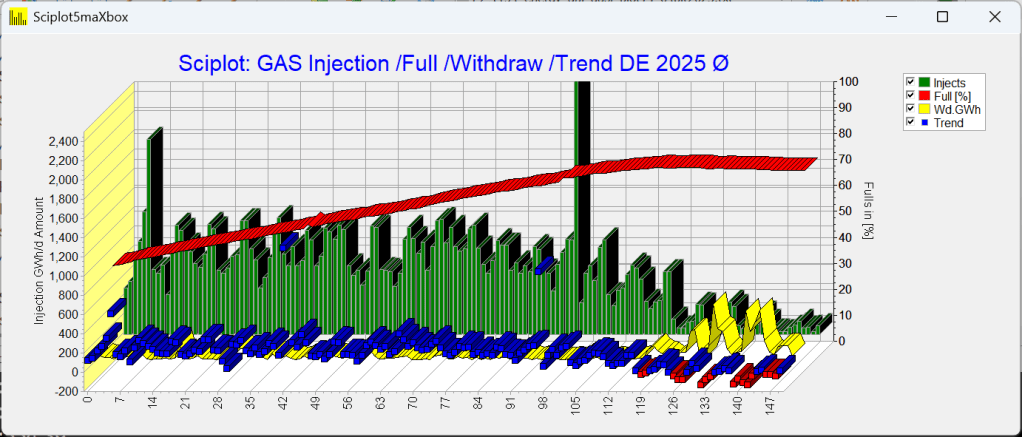
As we can see we have 4 series to plot (including timeline):
- Injection (Injection during gas day)
- Full (Storage / WGV (in%))
- Withdrawal (Withdrawal during gas day (2 digits accuracy)).
- GasDayStart (The start of the gas day reported)
The time series is a result of the gas day and a trend is available.
“Gas day” means the period from 5:00 to 5:00 UTC the following day for winter time and from 4:00 to 4:00 UTC the following day when daylight saving is applied. Gas day is to be interpreted as UTC+1 for CET or UTC+2 in summer time for CEST. (Definition: see CAM Network Code specific-cations).
API access is provided in a REST-like interface (Representational State Transfer) exposing database resources in a JSON format with content-type in the mentioned Response Header.
The code of the data science vision contains example usage, and runs under Python3, Delphi, Jupyter-Notebook, Lazarus and maXbox4. Note that the API service is made available to the public free of charge. ONLY the data as currently available on the platforms is made available.
Tip: To extract data direct from the system, you can click on one of these links in a browser (web traffic versus API traffic ;-)):
AGSI+ https://agsi.gie.eu/api?type=eu
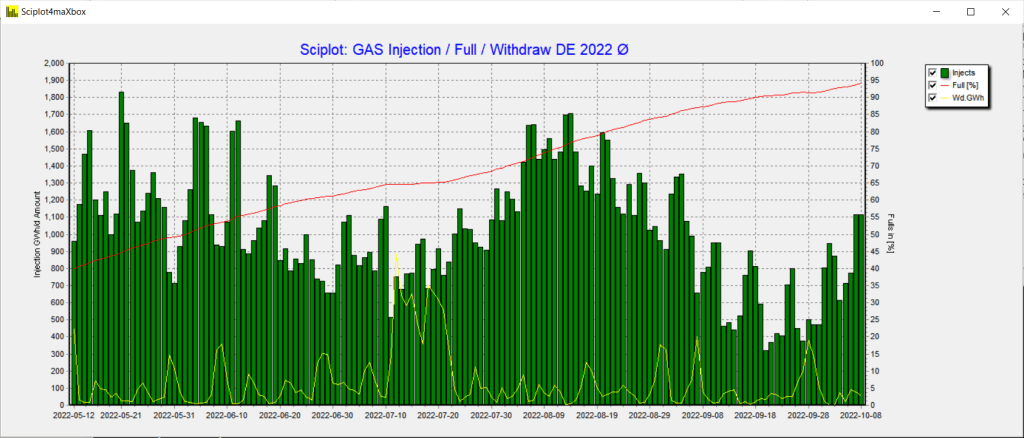
Conclusion:
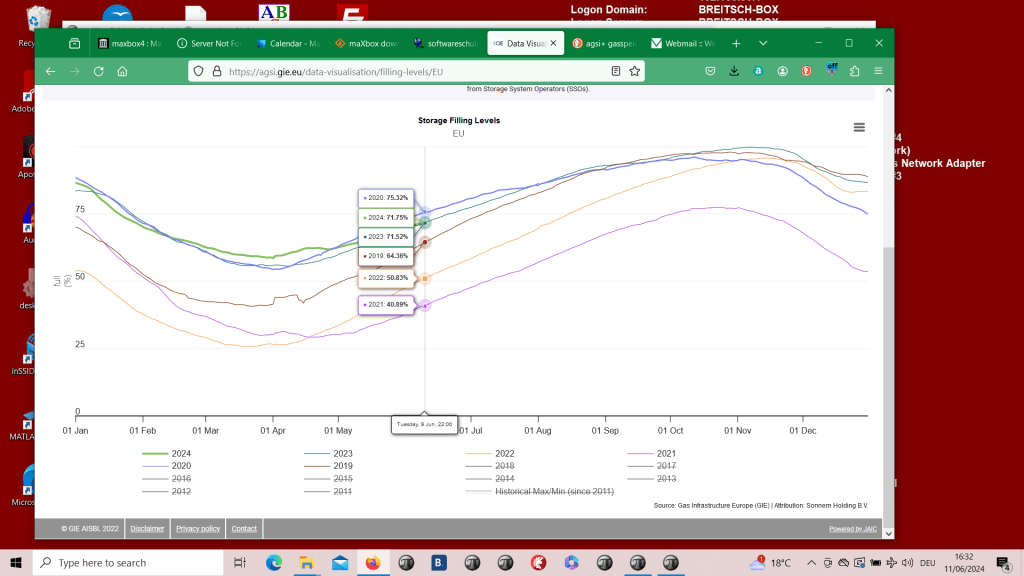
GIE is providing an API (Application Programming Interface) service on its AGSI and AGSI+ storage data. The API documentation is on progress and provides examples and guidance on how to use the service and is available after registration to get an API-key. Below zoom of the past half year:
Pic: 1154_agsi_plot15.png
Script the Win API mixed with DLL- or procompiled Function:
function InternetReadFile(
           hfile: HINTERNET;
           lpbuffer: string;
           dwNumberOfBytesToRead: DWord;
           var lpdwNumberOfBytesRead: DWord): boolean;
   {BOOL InternetReadFile(
    [in]  HINTERNET hFile,
    [out] LPVOID    lpBuffer,
    [in]  DWORD     dwNumberOfBytesToRead,
    [out] LPDWORD   lpdwNumberOfBytesRead }
   external 'InternetReadFile@Wininet.dll stdcall';


function HttpGetDirect2(const Url: string): string;
var
  NetHandle: HINTERNET;
  UrlHandle: HINTERNET;
  Buffer: string; //array[0..1024] of Char;
  BytesRead: dWord;
begin
  Result:= '';
  NetHandle:= InternetOpen('maXbox4 agent',INTERNET_OPEN_TYPE_PRECONFIG,'nil','nil',0);
  writeln('debug '+itoa(nethandle));
  //if Assigned(NetHandle) then begin
  Setlength(Buffer, 1024)
  if NetHandle <> 0 then begin
    UrlHandle:= InternetOpenUrl(NetHandle, pchar(Url),'nil', 0,INTERNET_FLAG_RELOAD,0);
    writeln('debug '+itoa(urlhandle));
    if UrlHandle <> 0 then begin{ UrlHandle valid? Proceed with download }
      //FillChar(Buffer, SizeOf(Buffer), 0);
      buffer:= ' ';
      repeat
        Result:= Result + Buffer;
        buffer:= ' ';
        //InternetReadFile(UrlHandle, @Buffer,sizeof(buffer), BytesRead);
        InternetReadFile(UrlHandle, Buffer, length(buffer), BytesRead);
      until BytesRead = 0;    //}
      InternetCloseHandle(UrlHandle);
    end else
      { UrlHandle is not valid. Raise an exception. }
      xraise( Exception.CreateFmt('Cannot open URL %s',[Url]));
    InternetCloseHandle(NetHandle);
  end else
    { NetHandle is not valid. Raise an exception }
    xraise (Exception.Create('Unable to initialize Wininet'));
end;
The scripts and images can be found:
https://github.com/maxkleiner/agsi-data
Reference:
https://svn.code.sf.net/p/alcinoe/code/demos/ALWinInetHTTPClient/_source/Unit1.pas
https://docwiki.embarcadero.com/Libraries/Sydney/en/System.Net.HttpClient.THTTPClient.Post
Doc and Tool: https://maxbox4.wordpress.com
Script Ref: 1154_energy_api_agsi_plot14.txt

Appendix: shows an WinAPIDownload class from maXbox4 integration
TWinApiDownload = class(TObject)
  private
    fEventWorkStart : TEventWorkStart;
    fEventWork : TEventWork;
    fEventWorkEnd : TEventWorkEnd;
    fEventError : TEventError;
    fURL : string;
    fUserAgent : string;
    fStop : Boolean;
    fActive : Boolean;
    fCachingEnabled : Boolean;
    fProgressUpdateInterval : Cardinal;
    function GetIsActive : Boolean;
  public
    constructor Create;
    destructor Destroy; override;
    function CheckURL(aURL: string) : Integer;
    function Download(Stream : TStream) : Integer; overload;
    function Download(var res : string) : Integer; overload;
    function ErrorCodeToMessageString(aErrorCode : Integer) : string;
    procedure Stop;
    procedure Clear;
    property UserAgent : string read fUserAgent write fUserAgent;
    property URL : string read fURL write fURL;
    property DownloadActive : Boolean read GetIsActive;
    property CachingEnabled : Boolean read fCachingEnabled write fCachingEnabled;
    property UpdateInterval:Cardinal read fProgressUpdateInterval write fProgressUpdateInterval;
    property OnWorkStart : TEventWorkStart read fEventWorkStart write fEventWorkStart;
    property OnWork : TEventWork read fEventWork write fEventWork;
    property OnWorkEnd : TEventWorkEnd read fEventWorkEnd write fEventWorkEnd;
    property OnError : TEventError read fEventError write fEventError;
  end;
Max Kleiner 10/10/2022
procedure TFormVisualLearningSaveScreenshot(filename: string);
begin
  try
    WriteLn(' Saving '+filename+'.');
    SaveHandleToBitmap(filename, FormVisualLearning.Handle);
  except
    // Nothing can be done if this fails.
  end;
end;


— Falcon Sandbox Analysis Summary —
File Name: maXbox4.exe
Analysis State: SUCCESS
Threat Verdict: no specific threat
Threat Score: n/a/100
AV Detection Ratio: n/a
AV Family Name:
Time of analysis: 2022-12-12 14:10:55
File Size (bytes): 34014488
File Type: PE32 executable (GUI) Intel 80386, for MS Windows
Contacted Domains: none
Contacted Hosts: none
Environment: Windows 10 64 bit (ID: 160)
Version 4.7.6.20


procedure TForm1FormCreateTest(Sender: TObject);
var Chart1: TChart; bs: TBarSeries; form1: TForm;
begin
  form1:= TForm.create(self);
  form1.setbounds(10,10,600,400);
  form1.show;
  chart1:= TChart.create(form1)
  chart1.parent:= form1;
  chart1.align:= alClient;
  Chart1.View3D:=false;
  bs:= TBarSeries.create(self);
  with Chart1.AddSeries(bs) {as TBarSeries} do begin
    Marks.Visible:=false;
    bs.MultiBar:= teembstacked; //teembSelfStack;
    FillSampleValues(10);
  end;
end;
Showcase
A showcase was published to how he uses JSON objects from HTTP requests to visualize aggregated gas storage inventory data into graphs and charts.
Why A Data Scientist Chooses Delphi For Powerful Real World Visualizations

Iterate within a JSON Array
The API returns the number of days, hours, working days, working hours, wages, weekend days, and the list of public holidays of the requested date period and country. You can also add any number of working days or working hours to a given date. 50 countries and over 230 regional calendars are supported and we work hard to keep our database up to date by following government announcements regarding public holidays changes.
https://rapidapi.com/joursouvres-api/api/working-days/
 "public_holidays": {
      "total": 10,
      "mondays": 4,
      "tuesdays": 0,
      "wednesdays": 0,
      "thursdays": 1,
      "fridays": 1,
      "saturdays": 1,
      "sundays": 3,
      "list":  [
         {     "date": "2022-01-01",
               "description" : "Jour de l'An"},
         {     "date": "2022-01-02",
               "description" : "Saint-Berchtold"},
         {     "date": "2022-04-15",
               "description" : "Vendredi Saint"},
         {     "date": "2022-04-18",
               "description" : "Lundi de Pâques"},
         {     "date": "2022-05-01",
               "description" : "Fête du Travail"},
         {     "date": "2022-05-26",
               "description" : "Jeudi de l'Ascension"},
         {     "date": "2022-06-06",
               "description" : "Lundi de la Pentecôte"},
         {     "date": "2022-08-01",
               "description" : "Fête Nationale suisse"},
         {     "date": "2022-12-25",
               "description" : "Noël"},
         {     "date": "2022-12-26",
               "description" : "Saint Etienne"}
        ]
    },
The point was to get the right iterator which counts the array without get access to the total value in combination of object and array:
 if httpq.getresponsecode=200 Then begin

   arcnt:= jo.values['public_holidays'].asobject['list'].asarray.count;
   for it:= 0 to arcnt-1 do
     result:= result+ jo.values['public_holidays'].asobject['list'].asarray[it].asobject['description'].asstring+CRLF
       end else result:='Failed:'+
            itoa(Httpq.getresponsecode)+Httpq.GetResponseHeader('message');
   except
      writeln('EWI_HTTP: '+ExceptiontoString(exceptiontype,exceptionparam));
   finally
writeln(‘public_holidays: ‘+CRLF+
utf8tostr(workdays_API2(‘AURL’, ‘aclient’,’2022-01-01′,’2022-12-31′,’CH’)));
const AURLS ='https://working-days.p.rapidapi.com/1.3/analyse?start_date=%s&end_date=%s'+'&country_code=%s';
public_holidays:
Jour de l’An
Saint-Berchtold
Vendredi Saint
Lundi de Pâques
Fête du Travail
Jeudi de l’Ascension
Lundi de la Pentecôte
Fête Nationale suisse
Noël
Saint Etienne
writeln(AskChatGPT(‘how to start a DCOM server?’)); Answer2:
- Open the Control Panel and select Administrative Tools.
- Select Component Services.
- Expand the Component Services node and select Computers.
- Right-click on My Computer and select Properties.
- Select the COM Security tab.
- Under Launch and Activation Permissions, select Edit Limits.
- Select Add and enter the user name or group name that will be allowed to start the DCOM server.
- Select OK and then select Apply.
- Select OK to close the Properties window.
- Right-click on My Computer and select Properties.
- Select the COM Security tab.
- Under Access Permissions, select Edit Limits.
- Select Add and enter the user name or group name that will be allowed to access the DCOM server.
- Select OK and then select Apply.
- Select OK to close the Properties window.
- Right-click on My Computer and select Manage.
- Expand the Services and Applications node and select Services.
- Right-click on the DCOM server and select Properties.
- Select the Log On tab.
- Select This Account and enter the user name and password of the user or group that will be allowed to start the DCOM server.
- Select OK to close the Properties window.
- Right-click on the DCOM server and select Start.
- The DCOM server should now be running.

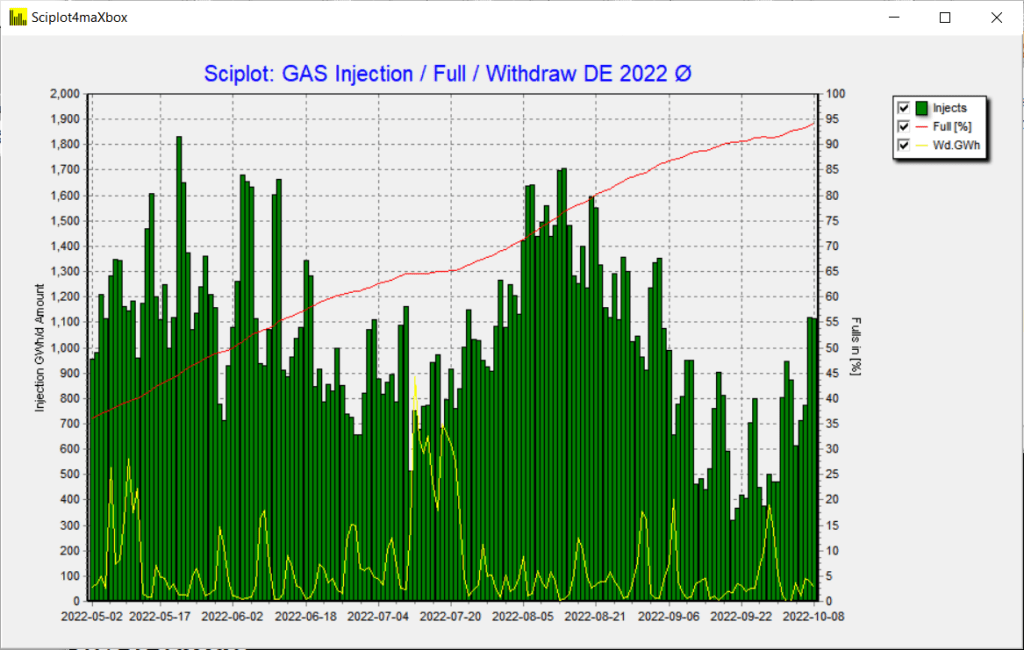
Long Term Time Serie over Years


According to Deloitte’s State of AI 5th edition research report, 94 per cent of business leaders agree that AI is critical to success over the next five years.
However, despite the increase in the use of artificial intelligence, the results lag behind. Even though 79 per cent of respondents said they had achieved full-scale deployment for three out of more applications than 62 per cent last year, the percentage of underachievers (high /deployment /low outcomes) rose from 17 per cent last year to 22 per cent this year, according to the report.
Some of the reasons for the low results vary depending on where organizations are in their AI deployment. Challenges for those starting new AI projects include proving AI’s business value (37per cent), lack of executive commitment (34 per cent) and choosing the right AI technologies (33 per cent).
LikeLike
Great Summary:
LikeLike